
Instrumenting Hono Logs with Pino and OpenTelemetry
OpenTelemetry lets you collect application logs in a vendor-neutral format and correlate them with traces. This article shows how to emit structured logs from a Hono backend with Pino and ship them to Loki and Tempo via the OpenTelemetry Collector.
OpenTelemetry is an observability framework for creating, collecting, and exporting telemetry data such as traces, metrics, and logs. It provides vendor-neutral APIs, SDKs, and protocols, which lets you decouple your application code from your monitoring backend.
OpenTelemetry is best known in the context of distributed tracing, but it also defines a data model for representing logs. When you send application logs in the OpenTelemetry format, each log can carry the Trace ID and Span ID of the current span. That lets you jump from an error log straight to the related trace and investigate exactly where the problem occurred.
In this article, we will emit structured logs with Pino from a
Hono backend running on Node.js. Logs and traces are sent to the OpenTelemetry Collector over OTLP (OpenTelemetry Protocol), and we will inspect logs in Grafana Loki and traces in Grafana Tempo.
Hono + Pino
  ├── Logs   ── OTLP/HTTP ──┐
  └── Traces ── OTLP/HTTP ──┘
                            ▼
                 OpenTelemetry Collector
                   ├── Loki (Logs)
                   └── Tempo (Traces)
                            ▼
GrafanaAs of August 2026, Traces and Metrics are Stable in OpenTelemetry JavaScript, while Logs is still marked as Development. The Logs API may change in the future, so check the current status before adopting it in a real product.
Sending logs to OpenTelemetry with instrumentation libraries
OpenTelemetry provides instrumentation libraries that generate telemetry automatically from existing libraries and frameworks, so you can send logs to OpenTelemetry without significantly rewriting your existing code. For Pino, the
@opentelemetry/instrumentation-pino package adds the following two capabilities.
- Log sending: passes Pino logs to the OpenTelemetry Logs SDK
- Log correlation: adds the active span's
trace_id,span_id, andtrace_flagsto Pino logs
Pino keeps writing JSON to standard output exactly as before. On top of that, Pino Instrumentation hands the same log event to the OpenTelemetry Logs SDK, and an exporter ships it to the OpenTelemetry Collector.
Notice that the application code never passes a Trace ID or Span ID to logger.info() explicitly. HTTP Instrumentation creates a span for the request and sets it as the active span in the OpenTelemetry Context for the duration of the request. Pino Instrumentation instruments calls such as logger.info() and reads the Trace ID and Span ID from whichever span is active at that moment.
tracer.startActiveSpan("userRepository.findById", async (span) => {
  // span is active at this point
  logger.info("finding user");
  // Pino Instrumentation attaches the span's Trace ID and Span ID automatically
});
Creating the Hono project
Let's start building the sample application. Create a Node.js project with the create-hono command.
npm create hono@latest hono-otel-logs -- --template nodejs --install --pm npm
cd hono-otel-logs
Next, install Pino and the OpenTelemetry packages. Rather than pulling in @opentelemetry/auto-instrumentations-node, which bundles every Node.js instrumentation, we install only the HTTP and Pino instrumentations individually.
npm install \
  [email protected] \
  @opentelemetry/[email protected] \
  @opentelemetry/[email protected] \
  @opentelemetry/[email protected] \
  @opentelemetry/[email protected] \
  @opentelemetry/[email protected] \
  @opentelemetry/[email protected] \
  @opentelemetry/[email protected] \
  @opentelemetry/[email protected]
Configuring the OpenTelemetry SDK
Create a src/instrumentation.ts file and initialize the OpenTelemetry SDK.
import { OTLPLogExporter } from "@opentelemetry/exporter-logs-otlp-proto";
import { OTLPTraceExporter } from "@opentelemetry/exporter-trace-otlp-proto";
import { HttpInstrumentation } from "@opentelemetry/instrumentation-http";
import { PinoInstrumentation } from "@opentelemetry/instrumentation-pino";
import { BatchLogRecordProcessor } from "@opentelemetry/sdk-logs";
import { NodeSDK } from "@opentelemetry/sdk-node";

// Send traces and logs to the Collector over OTLP/HTTP
const sdk = new NodeSDK({
  traceExporter: new OTLPTraceExporter(),
  logRecordProcessors: [
    new BatchLogRecordProcessor({
      exporter: new OTLPLogExporter(),
    }),
  ],
  // Instrument only the libraries we actually need
  instrumentations: [
    new HttpInstrumentation(),
    new PinoInstrumentation(),
  ],
});

sdk.start();

export const shutdownTelemetry = () => sdk.shutdown();
OTLPTraceExporter and OTLPLogExporter are exporters that send traces and logs, respectively, over OTLP/HTTP. Since we do not pass a destination to the constructor, they fall back to the OTEL_EXPORTER_OTLP_ENDPOINT environment variable that we will set later. The per-signal path is appended automatically: traces go to /v1/traces and logs go to /v1/logs.
BatchLogRecordProcessor buffers logs and exports them in batches, either when the buffer reaches a certain size (512 records by default) or after a certain interval has elapsed (1 second by default). Because it avoids blocking application work until the logs have been sent, production setups normally use batch processing instead of SimpleLogRecordProcessor.
We register only HttpInstrumentation and PinoInstrumentation in instrumentations. HttpInstrumentation instruments the Node.js HTTP server running behind Hono and creates a span per request. PinoInstrumentation sends Pino logs and injects the trace context.
PinoInstrumentation also accepts disableLogSending and disableLogCorrelation options, which let you turn off log sending and log correlation independently. That makes it possible to keep your existing log collection pipeline as-is and add only the trace context injection.
Emitting structured logs with Pino
Create the Pino logger in a src/logger.ts file.
import pino from "pino";

export const logger = pino({
  // Log at info level and above unless the environment variable says otherwise
  level: process.env.LOG_LEVEL ?? "info",
});
Beyond the log message itself, Pino lets you emit arbitrary attributes as JSON by passing an object as the first argument. Those attributes are also sent as attributes on the OpenTelemetry LogRecord. For example, here is how to pass a user ID as an attribute.
logger.info({ "app.user.id": "1" }, "finding user");For standardized attributes, use the names from the OpenTelemetry Semantic Conventions wherever possible. Sharing common names and values avoids the situation where every language and library invents its own naming. Telemetry gathered from multiple services can then be searched and aggregated with consistent semantics, which makes queries and dashboards easier to reuse.
For instance, use http.request.method for the HTTP method, http.route for the matched route, url.path for the request path, http.response.status_code for the response status code, and service.name for the service name. For application-specific attributes such as a user ID or a processing duration, use an app.* namespace instead, like app.user.id and app.duration_ms.
Implementing application logs and custom spans
Implement a findUserById() function in src/userRepository.ts that simulates fetching a user from a database. It emits finding user, user found, and user not found logs around the lookup, and a failed to find user log when an exception occurs. Each log carries the user ID as an attribute.
import { SpanStatusCode, trace } from "@opentelemetry/api";
import { setTimeout } from "node:timers/promises";
import { logger } from "./logger.js";

type User = {
  id: string;
  name: string;
};

const users = new Map<string, User>([
  ["1", { id: "1", name: "Alice" }],
]);
const tracer = trace.getTracer("user-repository");

export const findUserById = (id: string) =>
  // The currently active HTTP span is used as the parent
  tracer.startActiveSpan("userRepository.findById", async (span) => {
    span.setAttribute("app.user.id", id);

    try {
      logger.info({ "app.user.id": id }, "finding user");
      // Simulate the latency of a database round trip
      await setTimeout(50);

      if (id === "error") {
        throw new Error("database is unavailable");
      }

      const user = users.get(id);
      if (!user) {
        logger.warn({ "app.user.id": id }, "user not found");
        return undefined;
      }

      logger.info({ "app.user.id": id }, "user found");
      return user;
    } catch (error) {
      const exception =
        error instanceof Error ? error : new Error(String(error));

      // Record the exception details and an error status on the span
      span.recordException(exception);
      span.setStatus({
        code: SpanStatusCode.ERROR,
        message: exception.message,
      });
      logger.error(
        { err: exception, "app.user.id": id },
        "failed to find user",
      );
      throw exception;
    } finally {
      span.end();
    }
  });
We obtain a Tracer with trace.getTracer() and create a child span named userRepository.findById with startActiveSpan(). The parent span is normally determined by the current OpenTelemetry Context, so here the HTTP request span created by HTTP Instrumentation becomes the parent. Parent and child are linked through the child span's parent_span_id attribute.
GET /users/:id              ← parent: HTTP span
└── userRepository.findById ← child: application span
Any log emitted inside this callback automatically receives the child span's Trace ID and Span ID.
When an exception occurs, recordException() records an exception event on the span and setStatus() marks the span status as an error. Passing an Error object to Pino under the err property produces structured output containing the error type, message, and stack trace.
Implementing request logs in Hono
Next, implement the Hono routing and emit HTTP request logs. Rewrite src/index.ts as follows to implement these GET endpoints.
/users/:id: fetches a user. If the ID does not exist, it returns 404 and emits awarnlog./users/error: passingerroras the ID raises an exception. It returns 500 and emits anerrorlog.
import { serve } from "@hono/node-server";
import { trace } from "@opentelemetry/api";
import { Hono } from "hono";
import { routePath } from "hono/route";
import { shutdownTelemetry } from "./instrumentation.js";
import { logger } from "./logger.js";
import { findUserById } from "./userRepository.js";

const app = new Hono();

// "*" is a wildcard that matches every request
// Emit a single request log after the response completes
app.use("*", async (c, next) => {
  const startedAt = performance.now();

  await next();

  // Get the route of the last endpoint that matched
  const route = routePath(c, -1);
  const span = trace.getActiveSpan();
  span?.setAttribute("http.route", route);
  span?.updateName(`${c.req.method} ${route}`);

  const attributes = {
    "http.request.method": c.req.method,
    "http.route": route,
    "url.path": c.req.path,
    "http.response.status_code": c.res.status,
    "app.duration_ms": performance.now() - startedAt,
  };

  // Switch the log level based on the HTTP status code
  if (c.res.status >= 500) {
    logger.error(attributes, "request completed");
  } else if (c.res.status >= 400) {
    logger.warn(attributes, "request completed");
  } else {
    logger.info(attributes, "request completed");
  }
});

app.get("/users/:id", async (c) => {
  const user = await findUserById(c.req.param("id"));

  if (!user) {
    return c.json({ message: "User not found" }, 404);
  }

  return c.json(user);
});

app.onError((_error, c) => {
  return c.json({ message: "Internal Server Error" }, 500);
});

const server = serve(
  {
    fetch: app.fetch,
    port: 3001,
  },
  (info) => {
    logger.info({ port: info.port }, "server started");
  },
);

// graceful shutdown
const shutdown = (signal: NodeJS.Signals) => {
  logger.info({ signal }, "shutting down");
  server.close(async () => {
    // Flush any buffered logs and traces before exiting
    await shutdownTelemetry();
    process.exit(0);
  });
};

process.once("SIGINT", shutdown);
process.once("SIGTERM", shutdown);
The request log is emitted once the response completes. Because the HTTP method, route, URL path, status code, and duration are all passed as individual attributes, you can filter logs by value in Loki. For example, you can search for only the requests that took longer than 100 ms with something like app_duration_ms > 100 (Loki converts the periods in attribute names to underscores). Log levels are info for 2xx and 3xx, warn for 4xx, and error for 5xx.
Note that Hono's port is changed from the template's default to 3001, because Grafana occupies port 3000.
HTTP Instrumentation is not aware of Hono's routing, so automatic instrumentation alone produces span names like GET. That makes it impossible to tell different GET endpoints apart by span name. The HTTP semantic conventions recommend naming HTTP server spans
{method} {target} when a low-cardinality target such as a route is available.
So once the middleware finishes, we use routePath(c, -1) to get the last route that matched and set the http.route attribute. We then update the span name to GET /users/:id with updateName(). This way /users/1 and /users/unknown are aggregated as the same route, which also makes it easier to search and compare per endpoint. If you used the actual path as the span name, you would end up with a distinct span name for every user ID.
On shutdown, we close the HTTP server first and then call sdk.shutdown(). This flushes whatever data is still buffered in BatchLogRecordProcessor and the trace exporter before the process exits.
Initializing the OpenTelemetry SDK before the application
Pino Instrumentation hooks into the Pino module as it is loaded and adds log sending and trace context injection. That means the OpenTelemetry SDK has to be initialized and the instrumentations registered before the application loads Pino. The OpenTelemetry guide for Node.js likewise explains that instrumentation setup must run before your application code.
Because this sample uses ES Modules, it also needs an ESM loader hook to hook into module loading.
Change the scripts in package.json as follows.
{
  "scripts": {
    "dev": "node --experimental-loader=@opentelemetry/instrumentation/hook.mjs --import tsx --import ./src/instrumentation.ts --watch src/index.ts",
    "build": "tsc",
    "start": "node --experimental-loader=@opentelemetry/instrumentation/hook.mjs --import ./dist/instrumentation.js dist/index.js"
  }
}
--import ./src/instrumentation.ts initializes the OpenTelemetry SDK ahead of the application itself. --experimental-loader=@opentelemetry/instrumentation/hook.mjs is the hook that instruments HTTP and Pino when they are loaded as ES Modules.
:::warning
On Node.js 20.6 and later, using --experimental-loader prints a warning saying it may be removed in the future, as shown below. It does not affect behavior, and the message also points to register() from node:module as the alternative.
(node:12345) ExperimentalWarning: `--experimental-loader` may be removed in the future; instead use `register()`:
--import 'data:text/javascript,import { register } from "node:module"; import { pathToFileURL } from "node:url"; register("%40opentelemetry/instrumentation/hook.mjs", pathToFileURL("./"));'
:::
Starting the OpenTelemetry Collector and monitoring backends
Now let's prepare an environment to receive the logs and traces. We will use grafana/otel-lgtm, which bundles the OpenTelemetry Collector, Loki, Tempo, Grafana, and more into a single container for development, demos, and testing.
docker run --rm \
  --name otel-lgtm \
  -p 3000:3000 \
  -p 4317:4317 \
  -p 4318:4318 \
grafana/otel-lgtm:0.29.2grafana/otel-lgtm is an image intended for development, demos, and testing. Keep in mind that it is not a production-ready configuration.
The OpenTelemetry Collector bundled in grafana/otel-lgtm is configured as follows. The OTLP Receiver listens on 4317 (gRPC) and 4318 (HTTP), then forwards traces to Tempo and logs to Loki.
receivers:
  otlp:
    protocols:
      grpc:
        endpoint: 0.0.0.0:4317
      http:
        endpoint: 0.0.0.0:4318

processors:
  # Send data to the backends in batches
  batch:

exporters:
  # Send traces to Tempo
  otlphttp/traces:
    endpoint: http://127.0.0.1:4418
    tls:
      insecure: true

  # Send logs to Loki
  otlphttp/logs:
    endpoint: http://127.0.0.1:3100/otlp
    tls:
      insecure: true

service:
  pipelines:
    traces:
      receivers: [otlp]
      processors: [batch]
      exporters: [otlphttp/traces]

    logs:
      receivers: [otlp]
      processors: [batch]
      exporters: [otlphttp/logs]
Running the Hono application and sending logs
With everything in place, let's send some requests to the Hono application and ship the resulting logs and traces.
Start the Hono application with the environment variables required for OpenTelemetry instrumentation.
OTEL_SERVICE_NAME=hono-api \
OTEL_EXPORTER_OTLP_ENDPOINT=http://127.0.0.1:4318 \
OTEL_EXPORTER_OTLP_PROTOCOL=http/protobuf \
npm run dev
OTEL_SERVICE_NAME sets a shared service.name on the Resource for both logs and traces. OTEL_EXPORTER_OTLP_ENDPOINT points at the OpenTelemetry Collector's OTLP/HTTP endpoint.
From another terminal, send a few requests of each kind: a successful one, a 404, and one that raises an exception.
curl -i http://127.0.0.1:3001/users/1
curl -i http://127.0.0.1:3001/users/unknown
curl -i http://127.0.0.1:3001/users/error
On standard output, you will see Pino JSON logs like the following. These are the two logs emitted for a request to /users/error, formatted here for readability.
{
  "level": 50,
  "time": 1785644315215,
  "pid": 86258,
  "hostname": "localhost",
  "trace_id": "631f628fcedda17b3ddfdb209c5dbade",
  "span_id": "17e6f76c36eaf37a",
  "trace_flags": "01",
  "err": {
    "type": "Error",
    "message": "database is unavailable",
    "stack": "Error: database is unavailable\n    at <anonymous> (/app/src/userRepository.ts:19:15)\n    ..."
  },
  "app.user.id": "error",
  "msg": "failed to find user"
}
{
  "level": 50,
  "time": 1785644315215,
  "pid": 86258,
  "hostname": "localhost",
  "trace_id": "631f628fcedda17b3ddfdb209c5dbade",
  "span_id": "34e27910106cc378",
  "trace_flags": "01",
  "http.request.method": "GET",
  "http.route": "/users/:id",
  "url.path": "/users/error",
  "http.response.status_code": 500,
  "app.duration_ms": 53.476,
  "msg": "request completed"
}
Note how the Error object passed under the err property is broken out into type, message, and stack.
The Span ID on the failed to find user log (17e6f76c...) points at the userRepository.findById child span. The request completed log from the same request, on the other hand, carries the Span ID of the parent HTTP span (34e27910...). Both share the same Trace ID (631f628f...), so you can search for every log produced by a single request at once.
Viewing logs in Grafana
The logs you sent can be inspected in Grafana. Grafana lets you search, filter, and aggregate logs through the UI, and you can also query them with Loki's LogQL.
Open http://127.0.0.1:3000 in your browser. The initial username and password are both
admin. From the left-hand menu, open "Drilldown" → "Logs" and select the logs whose service_name is hono-api.
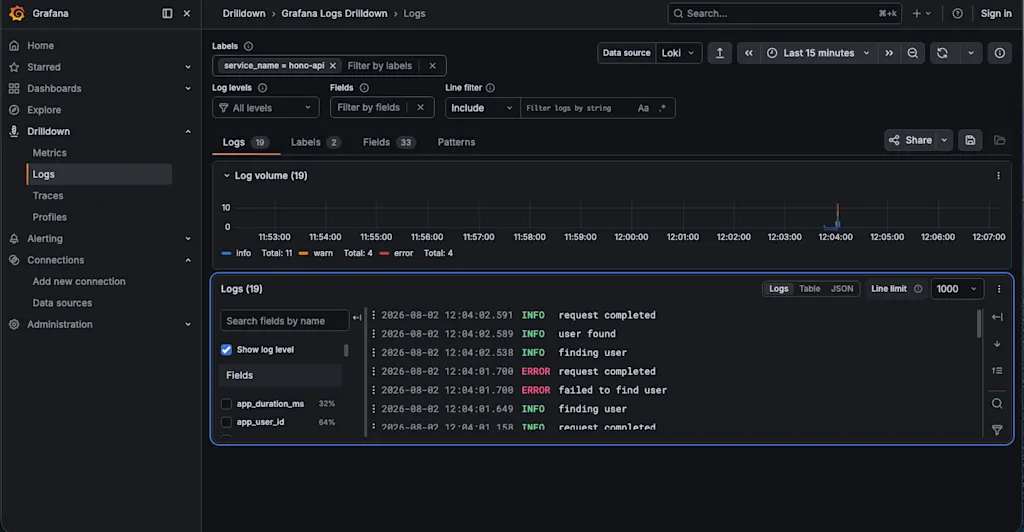
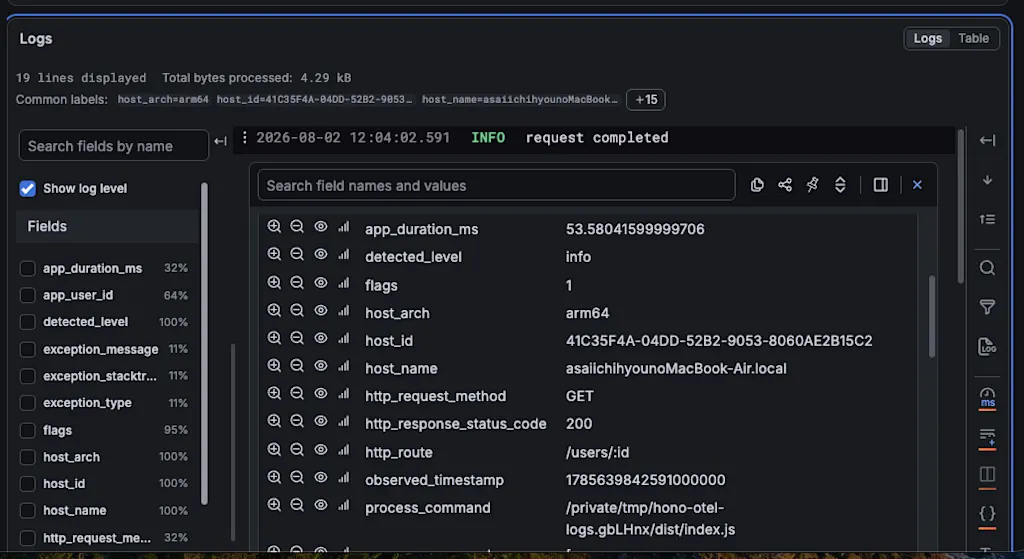
Attributes you passed to Pino, such as http.request.method and app.user.id, are displayed in Loki as http_request_method and app_user_id — periods are converted to underscores.
To show only error logs in LogQL, filter on detected_level like this.
{service_name="hono-api"} | detected_level = "error"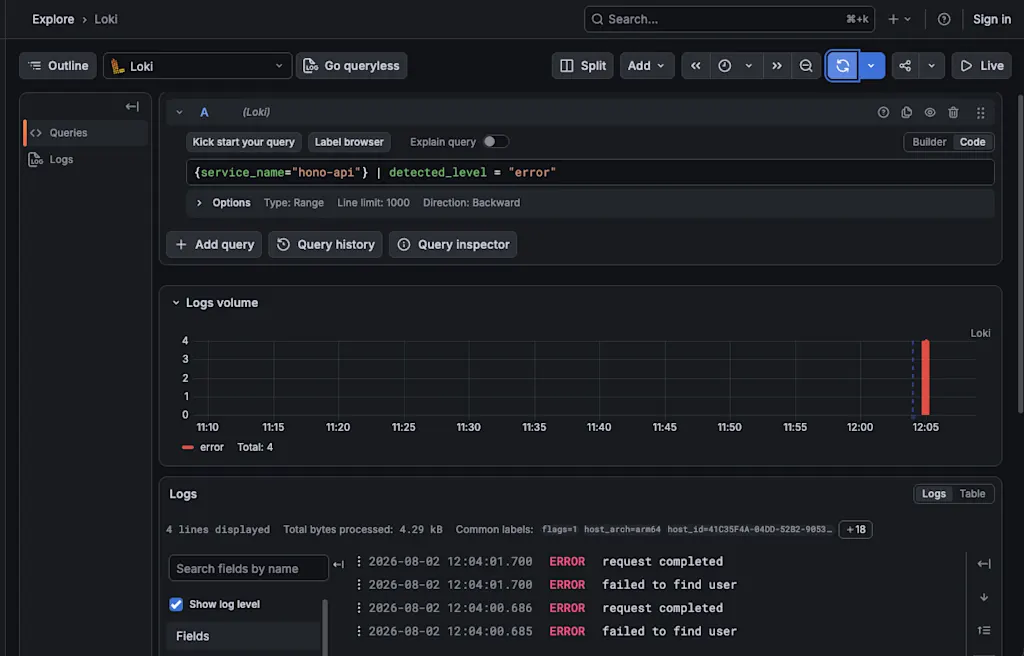
Jumping from a log to a trace
One of the benefits of sending logs through OpenTelemetry is that they can be correlated with traces. Pino Instrumentation attaches the active span's Trace ID and Span ID whenever a log is written. Tying logs and traces together by Trace ID means you can go beyond reading the error message and continue the investigation: which operations ran before the failure, and which span actually failed.
Expanding the failed to find user log reveals a link next to trace_id that opens the trace in Tempo.
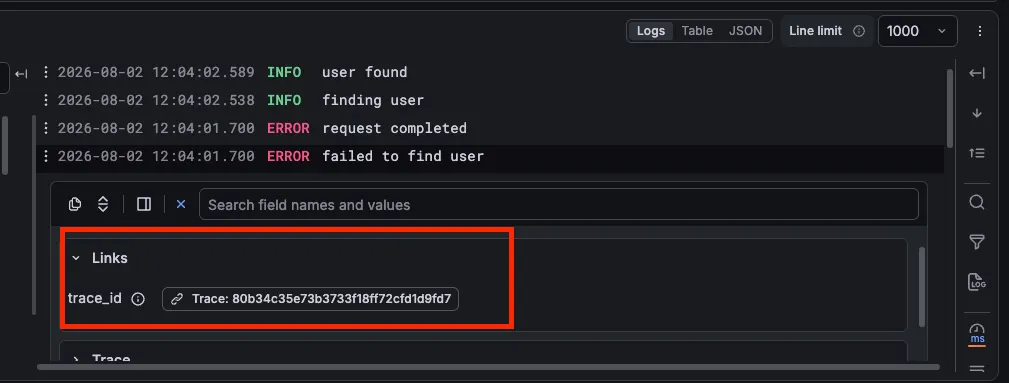
Opening the trace shows the userRepository.findById span as a child of the GET /users/:id HTTP span. The child span has an error status, and the database is unavailable exception event is recorded on it as well.
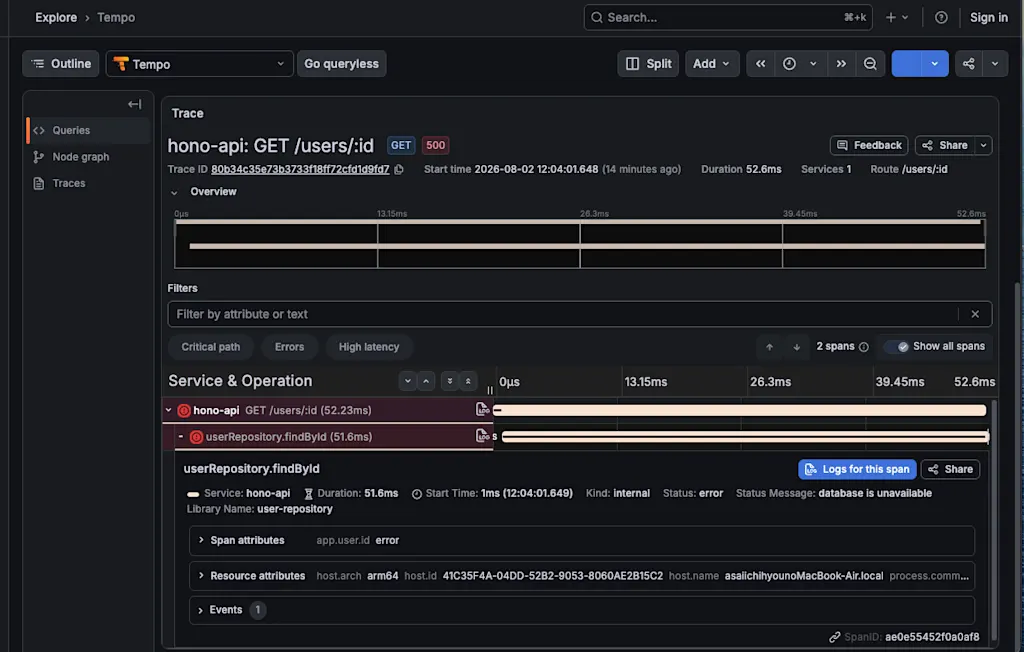
Conversely, selecting "Logs for this span" from a Tempo trace searches Loki for logs sharing the same Trace ID. That supports the opposite workflow too: pinpoint a slow or failing operation in the trace, then read the application logs emitted during it.
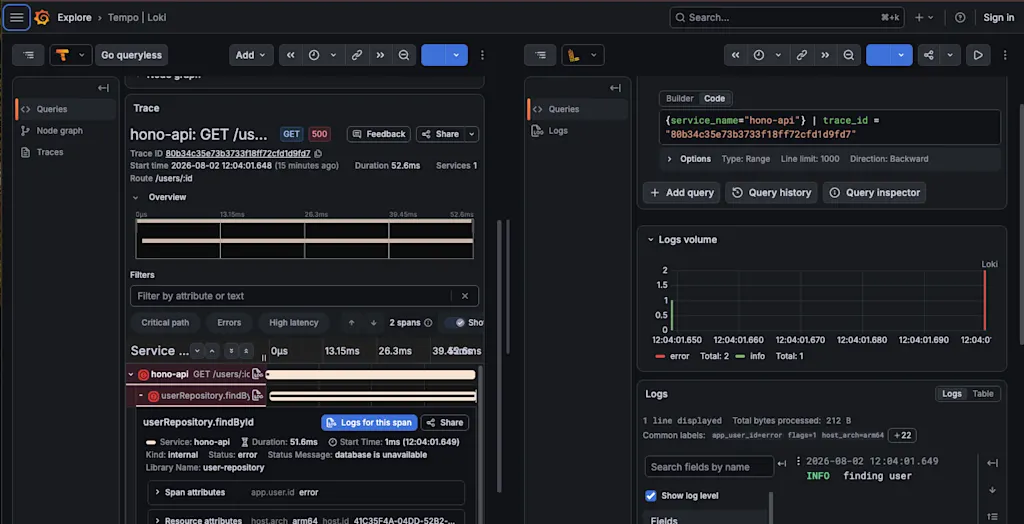
Logs and traces are sent as separate signals, so a Trace ID recorded on a log does not guarantee that the corresponding trace was stored. In production it is common to sample traces to keep costs down, and traces for requests that were not sampled never reach Tempo. In that case, trying to open the trace from a log may turn up nothing.
Summary
@opentelemetry/instrumentation-pinopasses Pino logs to the OpenTelemetry Logs SDK and adds the active span's Trace ID and Span ID to themHttpInstrumentationautomatically instruments Hono's HTTP requests, andtrace.getTracer()lets you create application-specific child spans- Logs and traces can be sent to the OpenTelemetry Collector over OTLP/HTTP and stored in Loki and Tempo
- A shared Trace ID lets you move in both directions in Grafana: from a log to its trace, and from a trace to its related logs